Growth & CRM · ANALYTICS
Find the day-eight retention cliff
D8
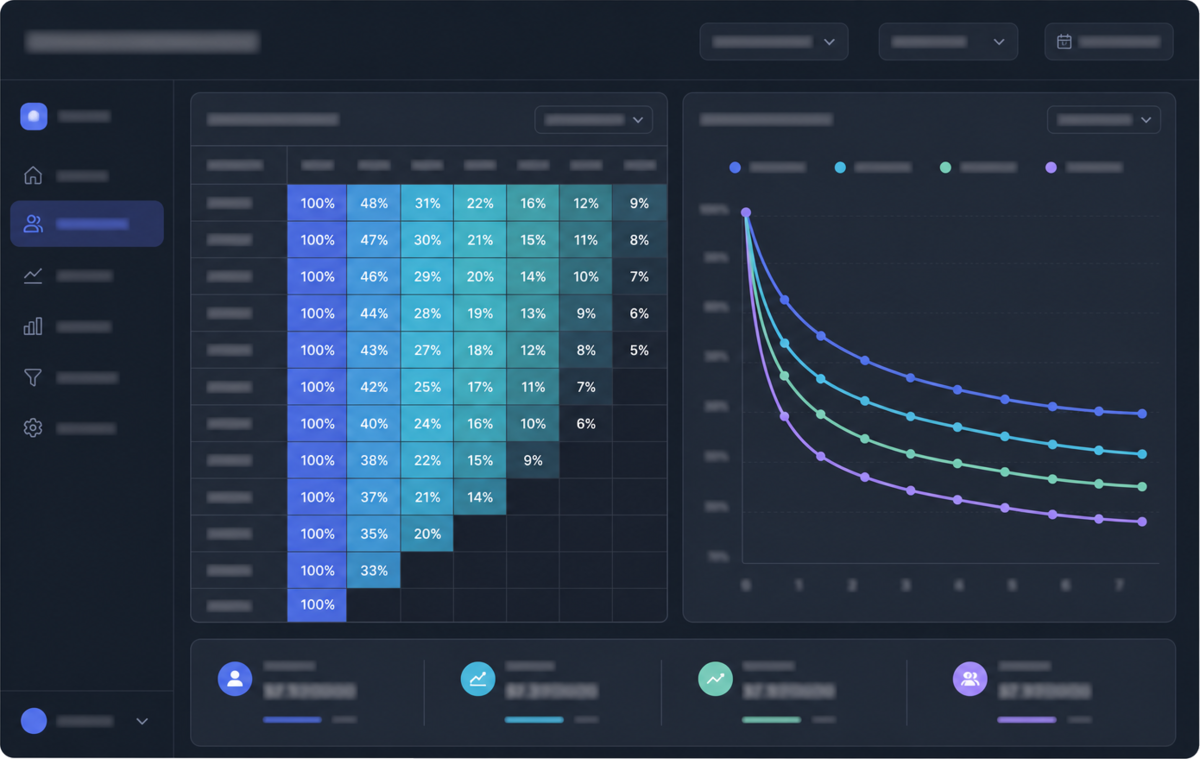
A flat average retention curve hides the cohorts that fall off a cliff. This engagement decomposes retention by acquisition channel and signup week until the cliff has a date, a channel and a cause you can watch.
The process
Rebuild cohorts from raw events
Signup week joined to activity events in the warehouse or PostHog, so the curve is computed from behaviour rather than read off a platform's own retention chart.
Split by channel and first action
Each cohort cut by acquisition channel, device and the first action taken — usually where the failing cohort separates from the average.
Locate the day, then read the sessions
The drop day identified per cohort, then session replay and event sequences from that day reviewed: an empty state, a paywall, a notification that never arrived.
Ship one intervention at the cliff
A single change placed just before the drop day — an onboarding step, a re-engagement trigger, or a targeting change if the cohort was mis-acquired in the first place.
Watch the next cohorts
New cohorts tracked against the pre-change curve; the claim is a shifted curve, not one good week.
What we need from you
- Event history with signup dates and channel attribution
- Access to your analytics property or warehouse
- Documentation of the current onboarding flow
What you get
- Retention curves by channel, device and first action
- Cliff diagnosis with replay evidence
- One shipped intervention and a cohort-tracking view
Timeline
Three to five weeks, plus the time cohorts need to mature.