Trends ·
Discovery moved to video. Most of the numbers proving it are not evidence.
The claim that Asian consumers now find products on social video rather than search is probably true and badly sourced. Here is the one figure that survives scrutiny.
Search a phrase like "consumers now discover products on social media rather than search engines" and you will get a wall of confident percentages. A majority of product discovery now happens on social video. Some share of shoppers prefer short-form video for evaluating products. Search's share of discovery is falling.
Follow any of them back and the same pattern appears. Most trace to marketing-industry surveys — usually global rather than Asian, usually re-quoted at second or third hand with the sample size, the question wording and the fieldwork date stripped away. Several of the most-cited figures circulate between vendor blogs until the original is no longer recoverable at all.
The underlying claim is, we think, broadly right. What almost none of the supporting evidence survives is being asked where it came from. That combination is worth saying out loud, because it changes what you can responsibly do with the claim.
Why survey data is the wrong instrument here
Ask someone where they discovered a product and you are asking for an accurate memory of an unremarkable moment, retrieved days or weeks later and sorted into categories the respondent did not choose. Three problems follow from that.
Discovery is not a single event. A shopper sees a product in a video, searches the brand name to check it is real, reads a marketplace review, and buys a week later after a friend mentions it. Which one was discovery? The survey forces a single answer; the purchase had four causes. Any instrument that requires one channel to win will systematically overstate whichever channel the respondent remembers most vividly, and video is designed to be memorable.
"Social" and "search" stopped being separate categories. A large share of what people do inside video and social apps is typing a query into a search box. Counting that as social rather than search is a defensible convention, but it is a convention — and a survey that offers both as options invites the respondent to apply their own. The reported split then partly measures how people classify their own behaviour.
The global figure does not transfer. Platform mix in Asia varies enormously by market, and a global average is a weighted blend dominated by wherever the sample was largest. Applied to Hong Kong, or Thailand, or Indonesia, it is not a measurement of anything.
The figure that does survive
Exactly one number in this area is solid enough to build on, and it earns that standing by counting transactions rather than recollections.
The e-Conomy SEA 2025 report — published November 2025 by Google, Temasek and Bain & Company, covering ten Southeast Asian markets — puts video commerce at approximately 25% of total e-commerce GMV in the region for 2025, within an e-commerce market it sizes at $185 billion GMV and $41 billion revenue, inside a digital economy surpassing $300 billion GMV. The report describes video commerce as having expanded five-fold in three years.
That is a different class of evidence. GMV is settled money attributed to a channel, not a memory of an impression. And the trajectory is the substantive part: a quarter of regional e-commerce now transacting through a format that was a rounding error at the start of the decade is a structural change, whatever any survey says about stated preference.
Two limits on it, stated plainly. It measures where the transaction closed, not where the demand was created — a purchase completed in a video app may have been influenced anywhere. And it is Southeast Asia. It is not a Hong Kong figure and should not be quoted as one.
What Hong Kong's public data does and does not tell you
For Hong Kong, the honest position is that the discovery split is not publicly measured.
What is available is context. DataReportal's Digital 2026 report for Hong Kong records internet penetration at 96.8% as of October 2025 and 6.24 million active social media user identities, equivalent to 84.4% of the population, with YouTube at 6.24 million and Facebook at 4.70 million. Separately, the Census and Statistics Department puts online retail sales at $3.0 billion in June 2026, 9.4% of total retail sales.
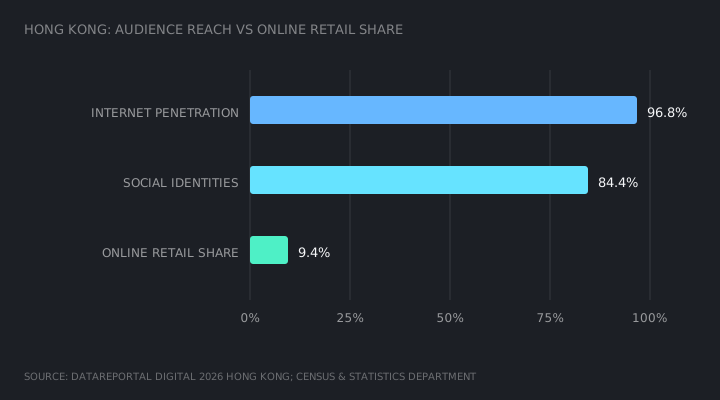
Read together, those establish that the audience is effectively universal while the online transaction share of local retail trade is still under ten percent. What they do not establish is where anyone found anything. Anybody quoting a Hong Kong discovery split is quoting a vendor survey, and should say so.
This is the gap worth naming: near-total social reach coexists with single-digit online retail share. Discovery and transaction have decoupled. Video is plausibly doing enormous work in Hong Kong that never shows up as an online sale, because the sale happens in a shop.
Measure it on your own traffic instead
The market-level number is not one you need. You need your own, and yours is both more accurate and more actionable.
Run a post-purchase "how did you first hear about us" prompt. One question, free-text or a short list you maintain, asked at the moment of purchase rather than weeks later. It inherits the recall problems above, but it is your customers rather than a global panel, and the bias is at least consistent over time — which means the trend line is usable even when the level is not.
Read referrer and landing-page data for what it can prove. It reliably shows the last click. It does not show discovery, and dark social — links pasted into chat apps, which is a great deal of Asian sharing behaviour — arrives as direct traffic. Treat a rising direct-traffic share as a signal that discovery moved somewhere you cannot see, not as evidence that people are typing your URL from memory.
Watch branded search volume as the honest proxy. If video discovery is working, people who saw you in a video will later search your brand name. Branded search volume is measurable and moves with a lag, and a rise in it against flat paid spend is the cleanest available evidence that upstream discovery is happening. Indirect, yes — and still more defensible than any survey percentage.
Separate the two questions in whatever you report. Where people find you and where they buy are different measurements with different instruments. Collapsing them into one "channel" column is what produces the conclusion that video does not work, in cases where video created the demand and the marketplace collected it.
So what
Stop sourcing strategy to the circulated discovery percentages. If a figure cannot be traced to a named study with a stated sample and date, it should not be in a plan, and in practice most of these cannot.
Build instead on the two things that hold: the direction is real and is evidenced on the transaction side, where video commerce reached roughly a quarter of Southeast Asian e-commerce GMV in 2025; and your own attribution, however imperfect, beats a global average applied to a market it did not sample.
The practical next step is a single number you probably do not currently have — the share of your new customers who name a video platform when asked at checkout, tracked monthly. Within two quarters that series will tell you more about your business than every statistic in the first two paragraphs of this brief.
On applying the same sourcing discipline to platform economics, see Platform fee schedules are public. Read them as a system. On which parts of a recurring measurement like this can be automated, see AI in the research workflow.