Operations · AUTOMATION
Monthly reporting from three days to one hour
3d→1h
Monthly reporting takes days because the numbers live in six tools and get re-typed into one spreadsheet. This engagement moves the copying into a pipeline and leaves the judgement with your team.
The process
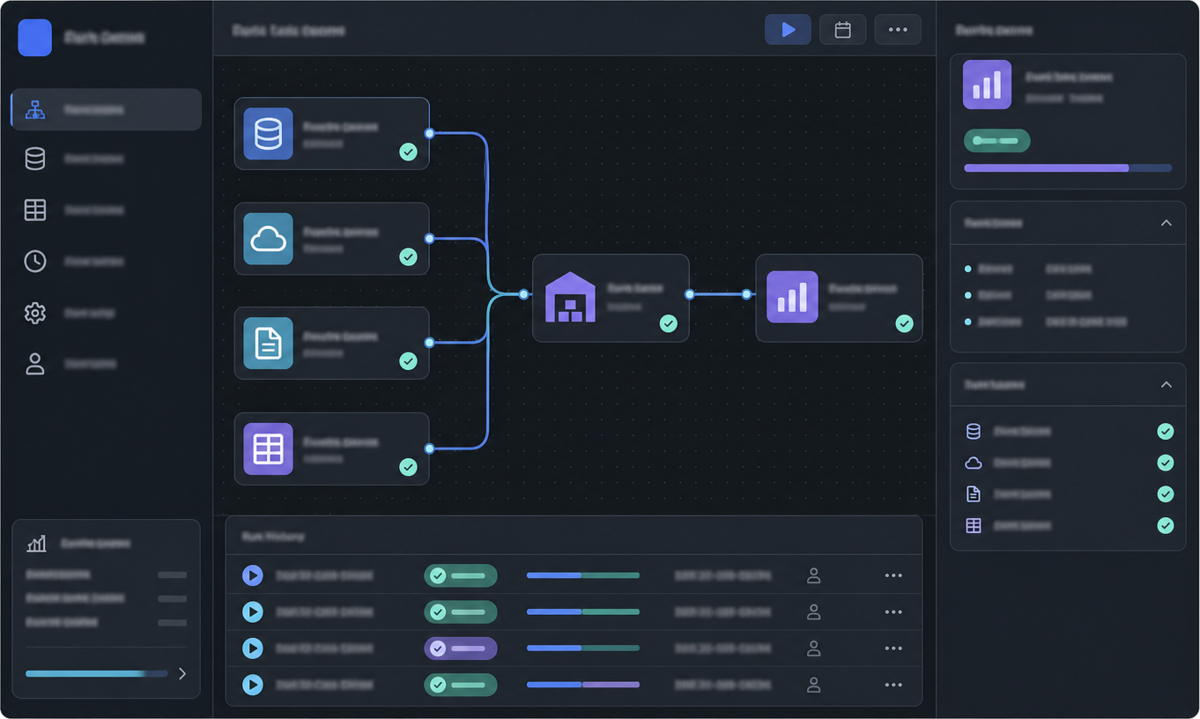
Inventory every source
Each SaaS the report touches — ad platforms, storefront, payments, helpdesk — listed with its API, its refresh cadence and who owns the login.
Land it in one warehouse
Scheduled extracts into a single warehouse, raw tables preserved, so a disputed figure can be traced back to what the source actually returned.
Define the metrics once
Revenue, orders, spend and margin defined in modelled tables with the business rules written down — one definition, not one per analyst.
Generate the report
Charts and tables rendered from the modelled layer into the format your team already reads, refreshed on schedule rather than on request.
Guard the numbers
Freshness and row-count checks fire before anyone reads the report, and a reconciliation view compares each metric against its source of record.
What we need from you
- Read access to each reporting source
- The current monthly report as the target
- One owner per contested metric definition
What you get
- Warehouse with scheduled ingestion
- Modelled metric layer with written definitions
- Auto-generated report with freshness and reconciliation checks
Timeline
Four to eight weeks, driven by how many sources are in scope.