平台 ·
Shopee leads on perception; TikTok Shop is close behind Lazada
YouGov's October 2025 Profiles and BrandIndex results measure recommendation and brand health, not GMV. Shopee leads both; TikTok Shop sits closer to Lazada on BrandIndex.
英文原文 — 本篇文章的中文版本尚未发布。
YouGov's Thailand results describe perception, not transaction performance. The recommendation figure shows how YouGov Profiles respondents answer a stated-recommendation question; BrandIndex is a separate six-component brand-health measure. Both are useful context for channel planning, so long as neither gets quietly relabelled as GMV, conversion or seller return.
The two measures answer different questions
Published on 23 October 2025, YouGov Profiles reported that 66.26% of its Thai respondents named Shopee, 52.2% named Lazada and 46.94% named TikTok Shop when asked which ecommerce or m-commerce sites they would recommend. That supports one comparison — stated recommendation among those respondents — and no others. It says nothing about continuous usage, purchase frequency, category conversion or market share.
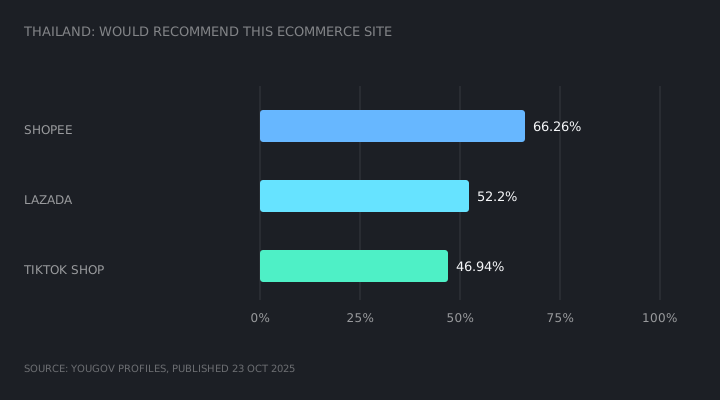
YouGov's BrandIndex result covers 20 October 2024 to 19 October 2025 and places Shopee at 60, Lazada at 45 and TikTok Shop at 43. BrandIndex averages Impression, Value, Quality, Reputation, Satisfaction and Recommend, and reports a net score from -100 to +100. Different instrument, different scale — which is why the two numbers cannot be combined or read as a single loyalty index, even though they point in a similar direction.
What the perception gap can, and cannot, inform
The gap frames a testable question: does a platform's consumer perception help a particular category acquire customers at an acceptable cost? Answering it takes category-level evidence — product-page conversion, cancellation, delivery performance, returns, contribution margin and repeat purchase. A recommendation survey cannot get there.
Trade.gov's account of the Thai marketplace environment supplies useful context around all of this: platform use, payment, logistics and cross-border conditions each shape the purchase path. None of it converts recommendation into a transaction metric. A brand-health score is similarly worth having for comparison, and similarly silent on seller profitability.
Keep the measurement layers separate
Run a platform review in three columns: consumer perception, transactional performance and seller economics. Recommendation and BrandIndex belong in the first. Paid order, conversion and cancellation belong in the second. Commission, vouchers, fulfilment, returns and service cost belong in the third. A strong perception signal is never a reason to leave the other two columns empty.
The same discipline keeps the timeframe visible. These are 2025 perception readouts, not a live dashboard, and current platform conditions should be rechecked before they are used to allocate a 2026 test budget.
So what
Use YouGov's results to set a perception hypothesis, then validate it against current category and unit-economics data. The decision is not which platform scores highest; it is whether a platform can convert and retain the intended customer at a cost the business can sustain.