基准 ·
Meta ad cost benchmarks for Hong Kong do not exist. Here is what does.
Meta publishes one worldwide pricing number and no country detail. Third-party benchmark tables publish a sample they do not describe. Here is what each source can and cannot answer.
英文原文 — 本篇文章的中文版本尚未发布。
The most common request we get on paid social is a version of the same question: what is a normal CPM for Hong Kong. It is a reasonable thing to want and there is no honest number to give. Meta does not publish it, the Hong Kong government does not collect it, and the third-party tables that appear to publish it are describing a different population.
None of which is an argument for ignoring benchmarks. It is an argument for knowing which of three tiers of data you are holding, because each answers a different question and only one of them is about your account.
Tier one: what Meta itself publishes
Meta discloses ad pricing in its quarterly results, and it discloses exactly two things about it. For the second quarter of 2026, ad impressions delivered across the Family of Apps increased 14% year-over-year and the average price per ad increased 12% year-over-year, against total revenue of $60.80 billion versus $47.516 billion in the same quarter of 2025.
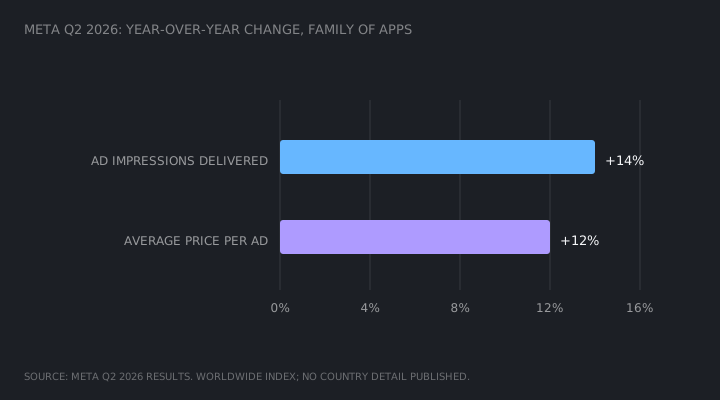
Note the shape of that disclosure. It is a rate of change, not a level. There is no CPM in it, no currency and no country. "Average price per ad" is a blend across every surface Meta sells — Feed, Reels, Stories, Audience Network — across every objective, every auction type, and every currency, weighted by wherever volume happened to land. A 12% increase in that index does not mean your CPM rose 12%, and a marketer who plans next quarter's budget on that assumption has misread a shareholder metric as a media planning input.
Meta's geographic reporting divides the world into four buckets, of which Asia-Pacific is one. That single bucket spans markets whose ad economics have almost nothing in common — Japan and India sit inside the same line. Hong Kong is not separately reported at any level of Meta's public disclosure, and no amount of arithmetic on a four-region split recovers it.
What tier one is genuinely good for: direction and magnitude of industry-wide auction pressure. If price per ad is climbing at double digits while impressions climb faster, that tells you supply is growing and monetisation per unit is still rising — useful context for why your costs drifted, useless as a target.
Tier two: third-party benchmark tables
The tables circulating as "Facebook ad benchmarks" come predominantly from one lineage: WordStream by LocaliQ, whose published figures put the average click-through rate for traffic campaigns at 1.71% across industries, up from 1.57% the prior year, and the average cost per lead for the leads objective at $27.66, up from $22.87.
Those are real numbers from a real dataset, and the correct caveat is not that they are wrong. It is that the published article discloses neither the sample size, nor the date range, nor the geography. It states only that the data comes from customer advertising campaigns. Without those three fields, the figures cannot be positioned relative to a Hong Kong advertiser at all — and the reporting currency being US dollars is a fairly strong hint about where the customer base sits.
A benchmark without a stated sample is not a benchmark. It is one agency's book, published.
There is a second and subtler problem. Benchmark tables are built from the advertisers who buy the vendor's software. That is a self-selected population, skewed toward the size, sophistication, and category mix the vendor sells into. The sample bias runs in the same direction as the metric being measured, which is the specific condition under which an average tells you least.
Tier three: your own account
Only the third tier measures the population you actually care about, and almost nobody treats it as a benchmark. Your own delivery history — CPM by placement, by audience, by month, over at least four quarters — is a real distribution drawn from the exact auctions you compete in, in your currency, against your competitors.
Its weaknesses are known rather than hidden, which is the whole advantage. You know your sample size. You know your date range. You know the geography, because you set it.
The Hong Kong gap, stated plainly
The Census and Statistics Department publishes Hong Kong's official social and economic statistics, and advertising cost per impression is not among the series it collects. There is no official Hong Kong CPM. Commercial estimates of Hong Kong ad spend exist behind paywalls at market research vendors, but those measure aggregate market spend, which is a different quantity from auction price and cannot be converted into one.
So for Hong Kong specifically: tier one gives you a worldwide index, tier two gives you an undescribed foreign sample, and tier three gives you your own account. Only the third is about you.
How to use the three tiers together
| Tier | Answers | Cannot answer |
|---|---|---|
| Meta quarterly disclosure | Is industry-wide ad pricing rising or falling, and how fast | What a CPM should be, in any market |
| Third-party benchmark tables | Roughly what order of magnitude a metric occupies | Whether your account is normal, for your market |
| Your own account history | What is normal for you, and when you departed from it | Whether your normal is competitive |
The gap in the third row is the real one, and it is worth naming rather than papering over. Own-account data cannot tell you whether your baseline is good, only whether it moved. Closing that gap requires comparable accounts in the same market and category, which means either a peer arrangement or a research provider with a disclosed panel — not a public table.
So what
Stop asking what a normal Hong Kong CPM is, because the answer will always be either unavailable or fabricated. Ask instead for a rolling twelve-month distribution of your own CPM by placement and by month, and set your alerting thresholds off its own variance rather than off an external figure. That converts an unanswerable question into a measurable one.
Then use tier one exactly once a quarter, as context for the direction of drift, and treat tier two as a magnitude check only — a signal worth investigating if you are five times off, and nothing at all if you are thirty percent off. Anyone quoting you a Hong Kong CPM benchmark without naming the sample, the period, and the placement mix is quoting you a number they cannot support.
Our companion note on how to read published fee tables as a cost structure rather than a rate is at Platform fee schedules are public. Read them as a system..