เกณฑ์เปรียบเทียบ ·
Two numbers are called the take rate — only one is published
A platform's published commission and the take rate derivable from its filings differ. Shopee's realised rate moved from about 8.6% to about 11.2% in a year.
ต้นฉบับภาษาอังกฤษ — บทวิเคราะห์นี้ยังไม่มีฉบับแปลภาษาไทย
Ask what a marketplace's take rate is in Asia and two different quantities come back under the same name. Mixing them is the most common error in channel modelling.
The first is the published rate: the commission percentage in a platform's fee schedule, set before the fact, applying per transaction, per category. The second is the realised take rate: total platform revenue divided by total merchandise value, computed after the fact from disclosed financials. The second is always higher than the first, and the gap between them is what actually decides channel economics.
The published rate: detailed, and narrower than it looks
Amazon publishes its schedule in unusual detail. The Professional selling plan is $39.99 per month, or $0.99 per item sold on the Individual plan. Referral fees vary by category, from a $0.30 per-item minimum up to 45% of sale price for Amazon Device Accessories. The category structure is more intricate than a single percentage suggests:
| Category | Published referral fee |
|---|---|
| Home and Kitchen | 15%, $0.30 minimum |
| Media (books, DVD, music, software, video) | 15%, plus a $1.80 per-item closing fee |
| Jewelry | 20% up to $250.00 of sale price, 5% on the portion above |
| Clothing and Accessories | 5% at or below $15.00, tiered up to 17% above $20.00 |
Read that table for what it is: a per-transaction rate on a defined base. It says nothing about advertising, fulfilment, storage, or promotional participation. A seller modelling Home and Kitchen at 15% has modelled one line out of several.
Across Southeast Asian marketplaces the published schedule is harder to obtain than Amazon's, and that deserves saying rather than glossing. Regional platforms publish rates per country site and revise them frequently, and the authoritative current version usually sits inside Seller Centre behind a login rather than on a public page. What circulates publicly is secondary summarisation by fee-calculator sites and consultancies. Those summaries may well be accurate; they are not primary, they are frequently stale, and they should not be quoted as though a platform had published them.
The realised rate: fewer platforms, harder numbers
Where a listed operator discloses both merchandise value and marketplace revenue, the realised rate can be computed from primary filings. Sea Limited does, for Shopee.
| Shopee | Q2 2026 | Q2 2025 |
|---|---|---|
| GMV | $38.3bn | approx. $29.8bn |
| Core marketplace revenue | $4.3bn | approx. $2.57bn |
| Implied realised rate | approx. 11.2% | approx. 8.6% |
| Gross orders | 4.2bn | approx. 3.3bn |
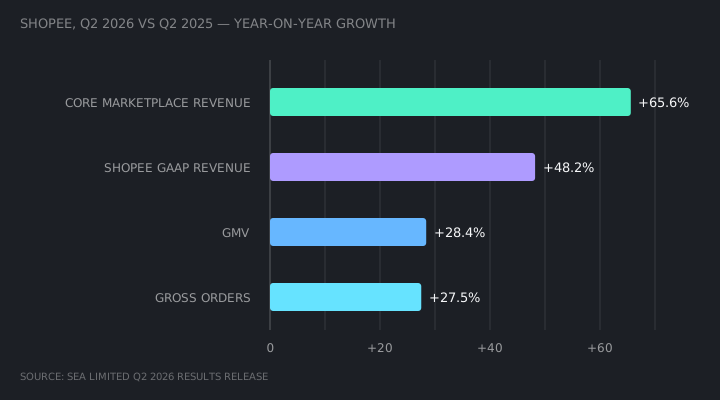
Sea reported Shopee GMV of $38.3 billion, up 28.4% year on year, gross orders of 4.2 billion, up 27.5%, Shopee GAAP revenue of $5.6 billion, up 48.2%, and core marketplace revenue up 65.6% to $4.3 billion, with Shopee adjusted EBITDA of $255.4 million. The prior-year figures in the table are derived from those disclosed growth rates rather than quoted directly, and should be read as approximations.
Three caveats belong with that 11.2%, and none of them is minor.
First, core marketplace revenue is described in the filing as consisting mainly of transaction-based fees and fees from advertising services. It is therefore a measure of monetisation intensity, not a commission rate. A seller's commission line and a platform's advertising revenue are different costs falling on different budgets, and this figure fuses them.
Second, it is blended across every market Shopee operates in. Country-level rates are not disclosed, so the number cannot be resolved to Singapore, Malaysia, Taiwan, or anywhere else individually.
Third, look at what moved. Core marketplace revenue grew 65.6% while GMV grew 28.4%, which is the whole story: the platform extracted materially more per dollar of merchandise without any of it appearing as a headline commission change. Monetisation rose through the layers that sit outside the commission line.
A published commission rate can stay still for a year while the realised take rate rises by two and a half points. Watching the fee schedule alone would have missed it entirely.
When the calculation is not available
Coupang publishes total net revenues of $8.9 billion for Q2 2026, with the Product Commerce segment at $7.4 billion and Developing Offerings at $1.4 billion. A realised take rate cannot be derived from this, and the reason is structural rather than a disclosure gap. Coupang's Product Commerce revenue is predominantly first-party retail, where reported revenue is the gross sale price of goods the company owns, not a fee on someone else's sale. Dividing it by anything produces a number that means nothing.
The distinction generalises. Take rates are only meaningful for platforms whose revenue is a fee on third-party volume, and any comparison table placing a 1P retailer beside a marketplace in a "take rate" column is comparing two different accounting objects.
| Platform | Published | Derivable | Not available |
|---|---|---|---|
| Amazon | Detailed per-category referral fees, subscription | Category-level cost per transaction | Country-level GMV or realised rate |
| Shopee (Sea Limited) | GMV and core marketplace revenue, group-wide | Blended realised rate, including advertising | Per-country rate; commission separated from ads |
| Coupang | Segment net revenues | Segment mix and growth | Take rate — 1P revenue is not a fee |
The Hong Kong gap
No marketplace discloses Hong Kong-specific GMV or revenue. Hong Kong sits inside regional aggregates where it is disclosed at all, and it is small enough relative to the region that the blended figures above should not be treated as describing it. A Hong Kong seller can obtain the applicable fee schedule for their own account, and cannot obtain a realised market take rate. That is the honest state of the data.
So what
Model the channel on the published schedule for your own category, since that is the only figure that is both primary and specific to you. Then use the realised rate from filings for one purpose: as a check on the direction and speed of monetisation. If a platform's realised rate is rising two and a half points a year, your cost of selling there is rising whether or not your commission line moved, and a three-year channel plan built on today's fee page is already wrong.
Two practical steps follow. Record the published schedule with the date and the country site you read it from, because these change without announcement. And each quarter, recompute the realised rate from the operator's own filing rather than from a comparison article. The ratio takes two numbers from one document and about a minute, and it is the earliest warning you will get that a channel is quietly repricing.
Our companion note on reading a fee page as a four-layer cost structure is at Platform fee schedules are public. Read them as a system..