แนวโน้ม ·
The least useful number in the Hong Kong retail release
Fourteen months of growth is the headline. The value-versus-volume gap, the category spread and the decelerating online line are what a seller should read.
ต้นฉบับภาษาอังกฤษ — บทวิเคราะห์นี้ยังไม่มีฉบับแปลภาษาไทย
Hong Kong's Census and Statistics Department publishes retail sales every month, roughly five weeks after the period closes, free, in both languages, with a category breakdown and a separate online series. It is one of the better public datasets available to anyone selling into this market, and it is mostly read for one number: the year-on-year change in total value.
For June 2026 that number was 4.6%, the fourteenth consecutive month of growth. It is a fact, correctly reported, and on its own it tells a seller almost nothing about their own category. Three other things in the same release do.
What the release actually contains
The figures below are all from the C&SD provisional releases for June 2026, for December 2025, and for the whole of 2025.
| Measure | Period | Figure |
|---|---|---|
| Total retail sales, value | June 2026 | $31.5bn, +4.6% yoy |
| Total retail sales, volume | June 2026 | +2.3% yoy |
| Total retail sales, value | H1 2026 | +9.6% yoy |
| Total retail sales, volume | H1 2026 | +7.2% yoy |
| Total retail sales, value | Full year 2025 | $380.5bn, +1.0% yoy |
| Total retail sales, volume | Full year 2025 | similar level to 2024 |
| Online retail sales | June 2026 | $3.0bn, 9.4% of total, +11.6% yoy |
| Online retail sales | H1 2026 | +27.7% yoy |
| Online retail sales | Full year 2025 | $35.7bn, +12.8% yoy |
Three readings the headline hides
First, value is running ahead of volume, and the gap is the story. In the first half of 2026, value rose 9.6% while volume rose 7.2%. C&SD publishes volume as the inflation-adjusted series, so the difference between the two lines is price and mix — shoppers paying more per unit, or buying a more expensive mix of units, rather than buying more units. Roughly a quarter of the headline value growth in H1 was not additional goods moving.
That distinction decides what a seller should do with the number. Planning inventory means using volume, which grew more slowly than the headline. Planning revenue against flat unit costs means value is closer to right. Reading the value figure as demand growth quietly overstates the units by the size of that gap.
Second, the category spread is far wider than the average. June 2026, year on year: jewellery, watches and clocks and valuable gifts +20.1%; electrical goods +11.3%; other consumer goods +9.3%; furniture and fixtures +5.1%; food, alcoholic drinks and tobacco +2.5%. Against that: fuels −15.3%; Chinese drugs and herbs −4.9%; motor vehicles and parts −4.3%; department stores −4.2%.
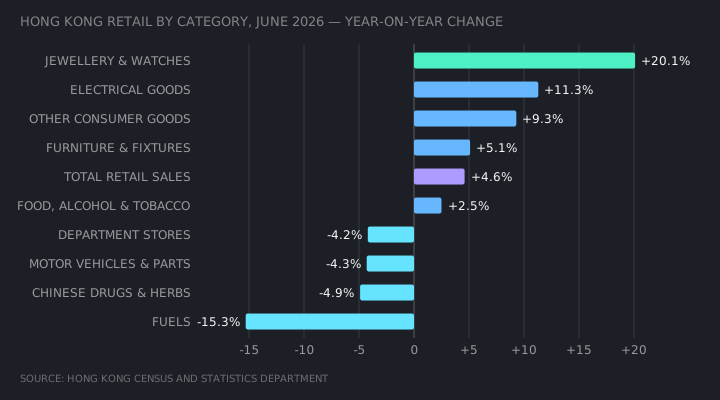
That is a spread of more than 35 percentage points inside a market whose average was 4.6%. Almost no seller experiences the average. A department-store concession and a jewellery retailer read the same press release and live in opposite markets.
The department-store line is the one worth sitting with. Department stores fell 4.2% while several of the categories they carry rose — a format losing share of the same demand, not a demand problem in those goods. Any reading of "Hong Kong retail is recovering" that fails to separate the goods from the format will attribute a channel shift to a consumer mood.
Third, the online line is decelerating even as it grows. Online retail sales grew 27.7% in H1 2026 but only 11.6% in June alone. Both are growth; the second runs at less than half the pace of the first. A half-year figure that far above its closing month means the strength sat early in the period, and the most recent month is the one nearest to your next quarter.
The level matters too. Online was $3.0bn in June, 9.4% of total retail sales. For the whole of 2025, online was $35.7bn against a $380.5bn total, which is about 9.4% on our own arithmetic of the two published figures — the same order. So online share has been broadly stable while the online growth rate has run well above the total. Those two facts sit together only because the base is small and month-to-month comparisons are noisy. The honest reading is that online in Hong Kong is a persistent high-single-digit share of measured retail, not a share visibly climbing toward the totals reported in larger markets.
A definitional caution that changes the number. C&SD's online series counts online sales by local retail companies captured in the Monthly Survey of Retail Sales. Purchases Hong Kong consumers make directly from overseas platforms are not local retail sales and are not in this series. The 9.4% is the online share of Hong Kong's retail trade, not the online share of Hong Kong consumers' spending. Those are different questions, and the gap between them is unmeasured here.
What this does and does not support
It supports a statement about direction. Hong Kong retail turned from a full-year 2025 that grew 1.0% in value and was flat in volume into a first half of 2026 that grew 9.6% and 7.2%. That is a real change in trajectory, and December 2025 at +6.6% shows the turn was already underway before the year closed. The 2025 annual figure is a poor guide to conditions now, since it averages a weak start with a recovering finish.
It does not support a forecast. Two of the strongest categories, jewellery and electrical goods, are the ones most sensitive to inbound visitors and to durable-goods replacement cycles respectively, and neither is a stable base to extrapolate from. The C&SD commentary itself attributes the improvement partly to inbound visitor growth, which makes some of this line a tourism number wearing retail clothing.
And it says nothing about any individual seller. A national series is a denominator. Its use is to tell you whether your own movement was you or the market — a category up 3% in a market up 4.6% lost ground, and would have looked like success without the comparison.
So what
Do three things with this dataset, none of which is quoting the headline.
Pull the category line closest to what you sell, not the total, and rebuild your own growth rate against that line rather than the market average. If your category is not separately published — most niches are not — pick the two published categories that bracket it and treat your true benchmark as sitting between them, stated as a range rather than a point.
Then hold value and volume apart in whatever you build. Volume for units, value for revenue, and never the headline number doing both jobs.
Finally, set a monthly reminder for roughly five weeks after each month closes and re-pull the release yourself. This series is revised, provisional figures are exactly that, and secondary coverage of it — this brief included — is a snapshot that starts ageing the day it is written. The primary release is free and takes two minutes to read. There is no good reason to be reading a summary of it at the moment you are making the decision.
For how the same discipline applies to reading a platform's published costs, see Platform fee schedules are public. Read them as a system.