หมวดสินค้า ·
Receipts grew 1.1%; restaurant input costs grew 3.6%
Hong Kong's Q1 2026 restaurant statistics show purchases outgrowing receipts. The margin squeeze, and which formats absorb it, matters more than the headline.
ต้นฉบับภาษาอังกฤษ — บทวิเคราะห์นี้ยังไม่มีฉบับแปลภาษาไทย
The Census and Statistics Department's Quarterly Survey of Restaurant Receipts and Purchases put total restaurant receipts at HK$28.4 billion for the first quarter of 2026, up 1.1% in value and 0.2% in volume year on year. The same release shows total purchases by restaurants — the inputs side, covering food, drink and supplies bought in — rising 3.6% to HK$9.1 billion.
Revenue up 1.1%, cost of goods up 3.6%, same quarter, same sector. That is a margin story rather than a growth story, and it is what an operator should be planning against.
Why the gap matters more than either number
Receipts describe what customers paid. Purchases describe what the business paid in order to serve them. When purchases grow more than three times faster than receipts, the arithmetic closes only two ways: margin compresses, or operators pass the cost through in menu pricing — which would itself show up as receipts growth, since receipts is a value figure that includes price. Receipts growing just 1.1% against a 3.6% rise in input cost says pass-through has been partial at best. Operators are absorbing a meaningful share of the increase rather than repricing menus to cover it.
That is a defensible operating choice, since repricing while competitors hold still carries its own risk. It is also a choice with a shelf life. A gap this size, sustained across successive quarters, erodes margin in a sector that runs thin margins to begin with.
The gap is not even across restaurant types
The same release breaks receipts down by restaurant type, and the pattern is far from uniform. Non-Chinese restaurants grew 2.8% in value and 2.1% in volume, so both revenue and covers served are up. Chinese restaurants grew 0.9% in value but fell 0.2% in volume, which means the modest revenue gain came from higher spend per visit rather than more visits. Fast food shops fell 0.6% in value and 1.5% in volume, the only major format losing both. Bars fell hardest, down 4.0% in value and 3.9% in volume.
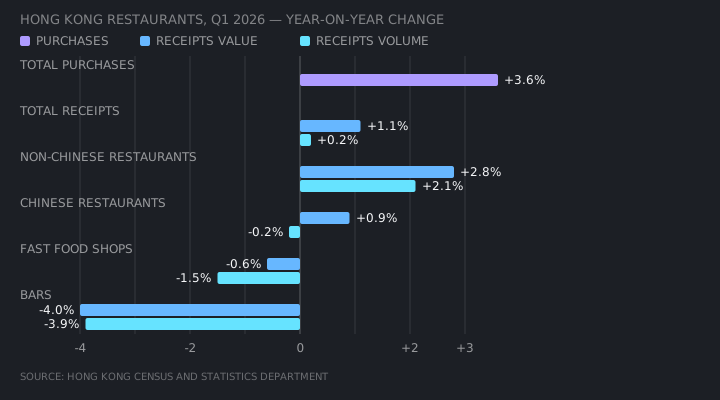
Set against the purchases figure, that spread describes very different exposure to one shared cost pressure. A fast food operator losing volume has less room to absorb rising input costs through scale, and less room to reprice without shedding more of the volume it still has. A non-Chinese restaurant operator gaining both volume and value has more room to test price, because demand is visibly not being deterred by whatever pricing is already in place. Bars, losing volume and value at once, are handling a demand problem stacked on top of the cost problem the whole sector shares.
What this means for a quarter of decisions
Model your own purchases-to-receipts ratio against the sector figures, not just your revenue trend. A restaurant with receipts flat or growing modestly, in line with the sector's 1.1%, should check whether its own cost of goods is tracking nearer the sector's 3.6% before reading flat revenue as a stable business. Margin compression sits comfortably underneath a revenue line that looks acceptable.
Segment repricing decisions by format, and use the volume figures as the read on pricing headroom. A format with volume growth alongside value growth — non-Chinese restaurants here — has evidence that customers will absorb a further adjustment. A format losing volume, such as fast food or bars, is already showing price or value resistance, and adding an increase without changing something else about the offer risks accelerating the decline rather than protecting margin.
And treat this quarter's cost pressure as a purchasing question before it becomes a menu question. Since receipts are only partly passing the purchases increase through, the more immediate lever for most operators is supplier terms, portion engineering and waste — not price, which the volume data suggests is already being tested at the low end of the format range.
So what
The figure worth carrying forward is the spread between 1.1% and 3.6%, not either number alone. It says the sector has not fully repriced for its own cost increases, and that the restaurant types still growing volume are the ones with the most room to close the gap through price rather than cost-cutting. The next quarterly release, roughly three months out, is the point to check whether the spread narrowed or widened before locking in a full-year pricing plan.